
 Solutions
 Cyber Security
 Cloud Security
 DevSecOps Automation
 Cyber Threat Intelligence
 AI & MLOps Integration
 Security Operations
 Incident Response & Forensics
 Services
 Cloud Architecture & Migration
 Zero Trust & IAM Solutions
 SOC-as-a-Service
 Threat Detection & Response
 DevOps Infrastructure Design
 Penetration Testing & Red Teaming
 AI-Driven Security Analytics
 Industries
 FinTech Cybersecurity
 Healthcare Cybersecurity
 E-Commerce Security
 Government & Defense Security
 Telecom & IoT Security
 Managed Security Services
 24×7 Managed SOC
 Managed SIEM & SOAR
 Endpoint Detection & Response
 Vulnerability Management
 Cloud & App Security Monitoring
 Compliance Management
 AI Security Lab
 AI-Driven Threat Defense
 Neural SOC Platform
 Predictive Attack Modeling
 Security Data Lake
 Research & AI Lab
 Threat Intelligence Reports
 AI Security Models
 Machine Learning for Cyber Defense
 Open-Source Tools
 Publications & Whitepapers
 AI Innovation Center
 AI Research & Development
 Generative Security Models
 Autonomous Threat Simulation
 LLM Security Framework
 Future Technology Roadmaps
 Global Threat Observatory
 Global Cyber Threat Map
 Real-Time Attack Feed
 Regional Threat Reports
 Zero-Day Tracker & Alerts
 AI Risk Index Dashboard
 Resources
 Technical Insights & Advisory
 Case Studies & Solution Workshops
 Security Guides & Readiness Resources
 Technical Workshops & Team Enablement
 Knowledge Base & Operational Documentation
Why Do AI Reports Disagree? Start With a Data Quality Assessment
When a dashboard, a finance export and an AI assistant give different answers to the same business question, start by comparing the information behind those answers. A data quality assessment helps separate definition, timing and pipeline problems from model problems. This guide explains how to investigate the disagreement, test likely causes and decide what to fix first.
AI-assisted technical guide · Updated 12 November 2026
Who this is for: business owners, analytics engineers and technical leads investigating inconsistent reports or unreliable AI answers. The examples are illustrative; they do not describe a client engagement.
Why reports and AI outputs disagree
Two outputs can look comparable while answering different questions. One report may count orders when payment is captured; another may count them when an invoice is issued. A dashboard might include refunds immediately, while a monthly export waits for a finance adjustment. An AI assistant may retrieve an older policy document even though a revised document exists in the source system.
These failures need different remedies. Retraining a model will not reconcile two definitions of revenue. Refreshing a dashboard will not correct a join that multiplies order rows. Adding more source documents will not help if the application supplies the wrong document revision. Start with a reproducible disagreement and trace it through the systems that produced it.
1. Define the decision and the reporting contract
Choose one business question with a clear owner. For example: “What was net product revenue for completed orders in October?” Avoid investigating every metric at once. Record the reports, their generation times, the observed difference and the decision affected. Establish whether users can continue with a qualified result or need the affected output withheld until reconciliation is complete.
Write a short reporting contract before changing any SQL or pipeline configuration. Include the business event being measured, the row grain, time zone, reporting interval, currency, treatment of taxes and refunds, excluded records and source of record. Define whether late events can change a previously published period. Assign a person who can resolve disagreements about meaning.
A row grain describes what one record represents: an order, an order line, a payment attempt or a customer-day. This matters because a valid order-line table can contain several rows for one order. A uniqueness check against the wrong grain produces false alarms; an order-level sum joined to multiple lines can inflate a total. Agree on the grain before interpreting duplicate counts.
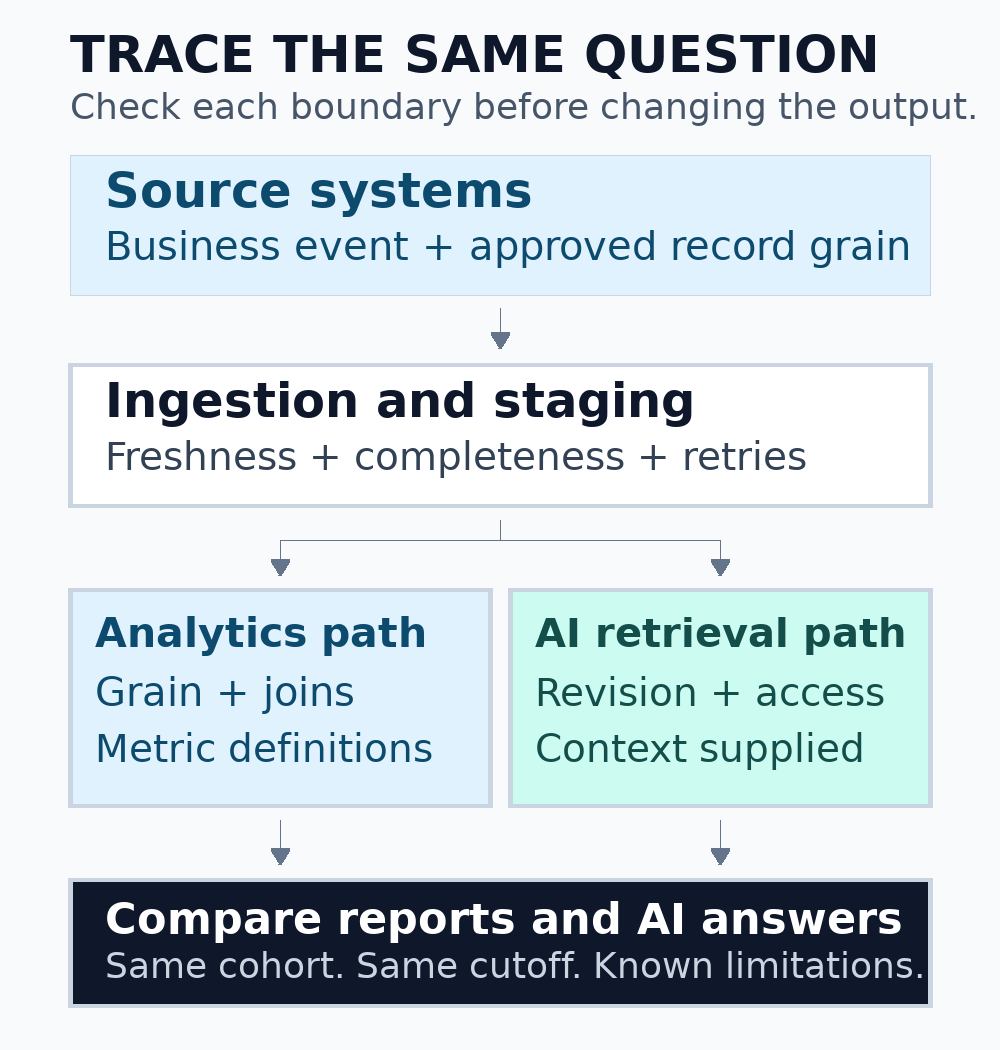
Figure 1. Trace the same business question through each path. A healthy upstream source does not prove that every downstream output uses the same definitions or revision.
2. Capture a comparable, privacy-conscious evidence set
Save the query or report configuration for each output, together with its filters, refresh time and software or model version where relevant. Prefer aggregate counts and pseudonymous record identifiers over full customer exports. Store the evidence in an approved location with access limited to the people investigating the issue. Preserve enough detail to reproduce the result without creating another uncontrolled copy of sensitive data.
Compare the same reporting period and the same data availability cutoff. An event occurring on Monday but arriving in the warehouse on Tuesday has two useful timestamps: event time and ingestion time. A Monday report created before that arrival may legitimately differ from one created later. Label both the business interval and the data-as-of time so readers understand what was available.
Database isolation can also affect comparisons. PostgreSQL documents that successive statements under Read Committed can see different committed data, while Repeatable Read uses a stable transaction snapshot. If several queries must reconcile against one snapshot, choose an appropriate read-only transaction or controlled extract with your database administrator. A consistent snapshot within one database does not synchronize separate warehouses or external APIs. See the PostgreSQL transaction isolation documentation.
3. Trace lineage and locate the first disagreement
Map the route from the source application through ingestion, staging, transformations, semantic models and presentation. For AI retrieval, include the document store, indexing process, retrieval filters and the material actually supplied to the model. Record the owner, transformation version and update schedule at each boundary. Use a small diagram that an engineer and a business owner can both follow.
Compare counts and totals at consecutive boundaries using the same cohort. Where possible, partition by a non-sensitive dimension such as reporting date or source system. Find the earliest stage where the agreed expectation stops holding. A mismatch already present in staging points toward ingestion or source interpretation; one introduced after a join points toward transformation logic. Investigate the first failing boundary before rewriting the final dashboard.
Also inspect the exception path. Failed rows may be quarantined, API pages may be retried, a backfill may bypass the normal schedule, or a manual spreadsheet adjustment may enter downstream. An apparently successful pipeline run is evidence of execution, not proof that every expected business record arrived exactly once.
4. Choose checks that match the suspected failure
Use targeted checks to test an explanation. The following comparison table helps connect an observed symptom to the next evidence to collect. Several causes can coexist, so treat a passing check as one piece of evidence rather than a complete quality certificate.
| Symptom | Possible cause | Useful evidence |
|---|---|---|
| Totals rise after a join | One-to-many expansion at the wrong grain | Key counts and totals before and after the join |
| Yesterday changes after refresh | Late events, corrections or backfills | Event time, ingestion time and correction history |
| Differences cluster at midnight | Time-zone or reporting-boundary mismatch | Original timestamps, offsets and conversion rules |
| One business unit is missing | An incomplete load, filter or access rule | Expected source partitions and effective permissions |
| An AI answer cites an old policy | Stale index or incorrect document selection | Retrieved text, revision ID and index completion time |
| Numbers differ consistently | Different metric definitions or exclusions | Calculation logic and the approved reporting contract |
Time-zone problems deserve explicit checks. PostgreSQL distinguishes timestamps with and without time zone; their behavior is not interchangeable. Agree on how an event is stored and how its business reporting date is derived. Avoid silently assuming that an unqualified timestamp represents UTC. Review the relevant date/time type documentation for your database version.
5. Run small, read-only checks before changing data
The examples below use an illustrative analytics_orders table containing one row per order. Its reporting_date is an already-agreed business date. Adapt table and column names, review the query plan and use a reporting replica or approved execution window where appropriate. Read-only queries can still consume substantial resources on a large dataset.
First, test whether the selected cohort violates the expected order-level grain:
SELECT order_id, COUNT(*) AS rows_per_order
FROM analytics_orders
WHERE reporting_date >= '2026-10-01'
  AND reporting_date < '2026-11-01'
GROUP BY order_id
HAVING COUNT(*) > 1;
Investigate returned identifiers against the data contract. Repeated rows may represent a replayed load, but they may also reveal that the table actually contains line items or historical versions. Do not delete rows merely because this query returns them. Determine the intended key, record history and replay rules first.
Next, measure missing keys and distinguish them from duplicates:
SELECT COUNT(*) AS total_rows,
       COUNT(order_id) AS rows_with_order_id,
       COUNT(DISTINCT order_id) AS distinct_order_ids
FROM analytics_orders
WHERE reporting_date >= '2026-10-01'
  AND reporting_date < '2026-11-01';
The difference between total rows and rows with an identifier is the missing-key count. The difference between non-null identifiers and distinct identifiers shows repeated non-null keys. Neither measure checks whether an identifier belongs to the correct customer or whether its associated monetary value is accurate. Follow with business-rule and source reconciliation checks.
6. Separate freshness, completeness and correctness
A recent maximum load timestamp does not prove a complete load. One newly arrived row can make a freshness check pass while another partition is missing. Pair freshness with expected source coverage, volume checks and an explicit completion signal where the ingestion design provides one. Account for weekends, quiet periods and planned maintenance when setting thresholds.
In a dbt-based workflow, built-in tests cover uniqueness, non-null values, accepted values and relationships. Use these alongside domain-specific assertions; choose configuration syntax for the installed release. A passing relationship test does not prove that a business association is correct. See dbt’s data test documentation.
Define freshness thresholds around the decision being supported. A daily management report and a live operational dashboard need different expectations. dbt documents source freshness configuration and its dependence on timestamps or supported metadata. Keep these checks separate from reconciliation of business events and totals. See dbt’s source freshness guidance.
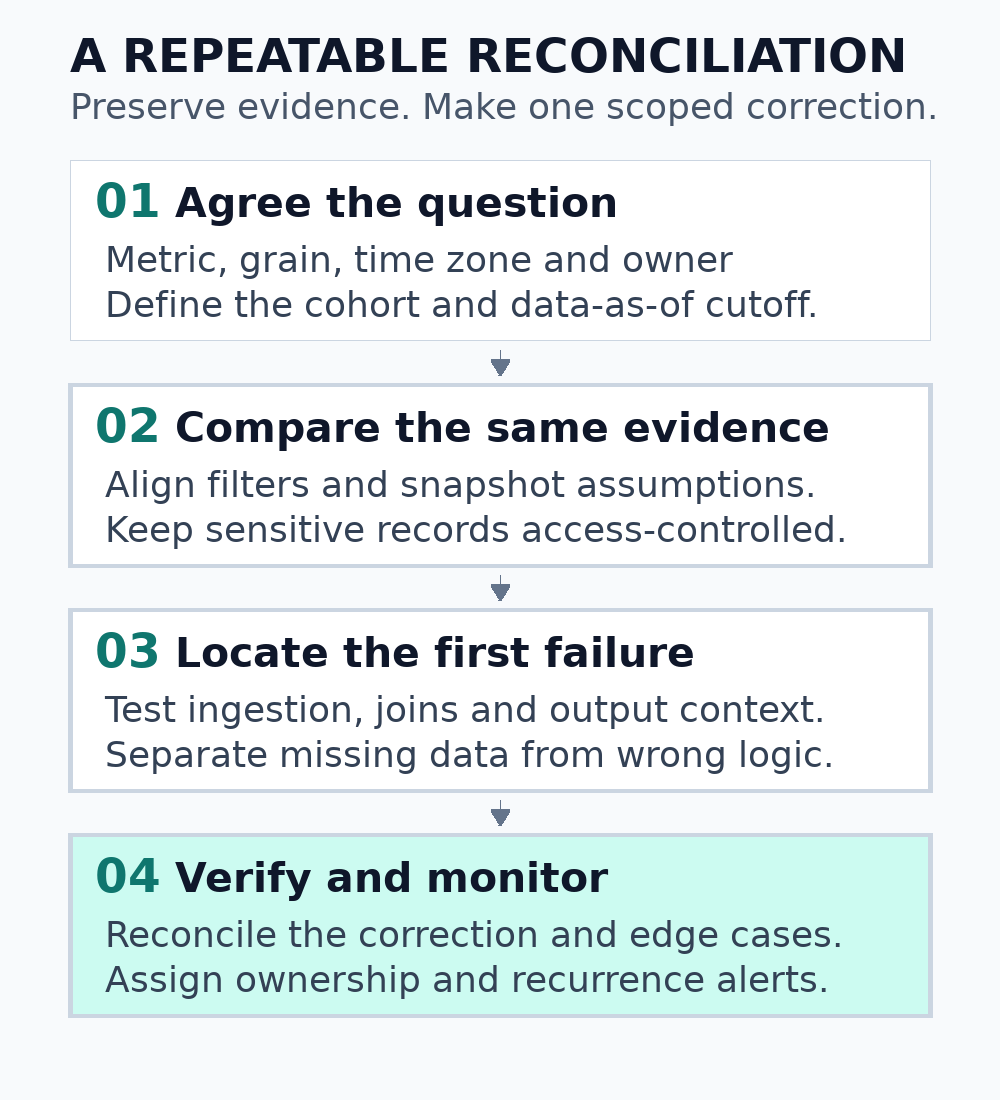
Figure 2. Make the investigation repeatable. Preserve the original evidence, apply a scoped correction and confirm both reconciliation and ongoing detection.
7. Check the AI input before changing the model
For an AI-assisted report, retain the permitted input context, retrieval results, relevant document versions, prompt version and model identifier. Re-run a small evaluation set under controlled conditions. Separate cases where the correct evidence never reached the model from cases where the model misinterpreted evidence it received. The first usually calls for a data or retrieval investigation; the second needs application and model evaluation.
Check document permissions as well as freshness. A current document that the requesting user cannot access should not be added to the response context simply to improve an answer. Investigate access-aware retrieval and test with representative permission groups. Keep evaluation evidence appropriately restricted, and avoid placing confidential prompts or customer records in publicly shared troubleshooting material.
8. Verify the correction and assign ongoing ownership
Make one scoped correction with a rollback or recovery plan appropriate to the system. Recompute the agreed cohort, compare it against the approved source and repeat the check for adjacent periods. Test the edge case that exposed the failure: a late refund, a replayed event, a missing partition or a changed document revision. Record any remaining difference and obtain business-owner acceptance rather than silently adjusting a dashboard until it looks right.
Finish with a short operating record: the metric contract, lineage, detected cause, evidence, correction, test result, owner and recurrence alert. If previously shared reports changed, tell their users which periods were affected and whether decisions need reconsideration. Make freshness and known limitations visible near the output so the next reader can assess fitness for use.
When to involve Informatix Systems
If inconsistent information crosses multiple applications, pipelines or AI workflows, a scoped assessment can establish where the disagreement begins and what evidence is needed. Start with one affected decision, the systems involved and a non-sensitive example of the discrepancy. Useful deliverables can include a source-to-output map, prioritized quality checks, a reconciliation plan and monitoring responsibilities; the exact scope should be agreed before work begins.
Explore Informatix Systems’ AI & MLOps integration services, or discuss a data quality assessment. Share the business question, affected systems and operational impact. Send sensitive datasets only through an agreed secure channel.